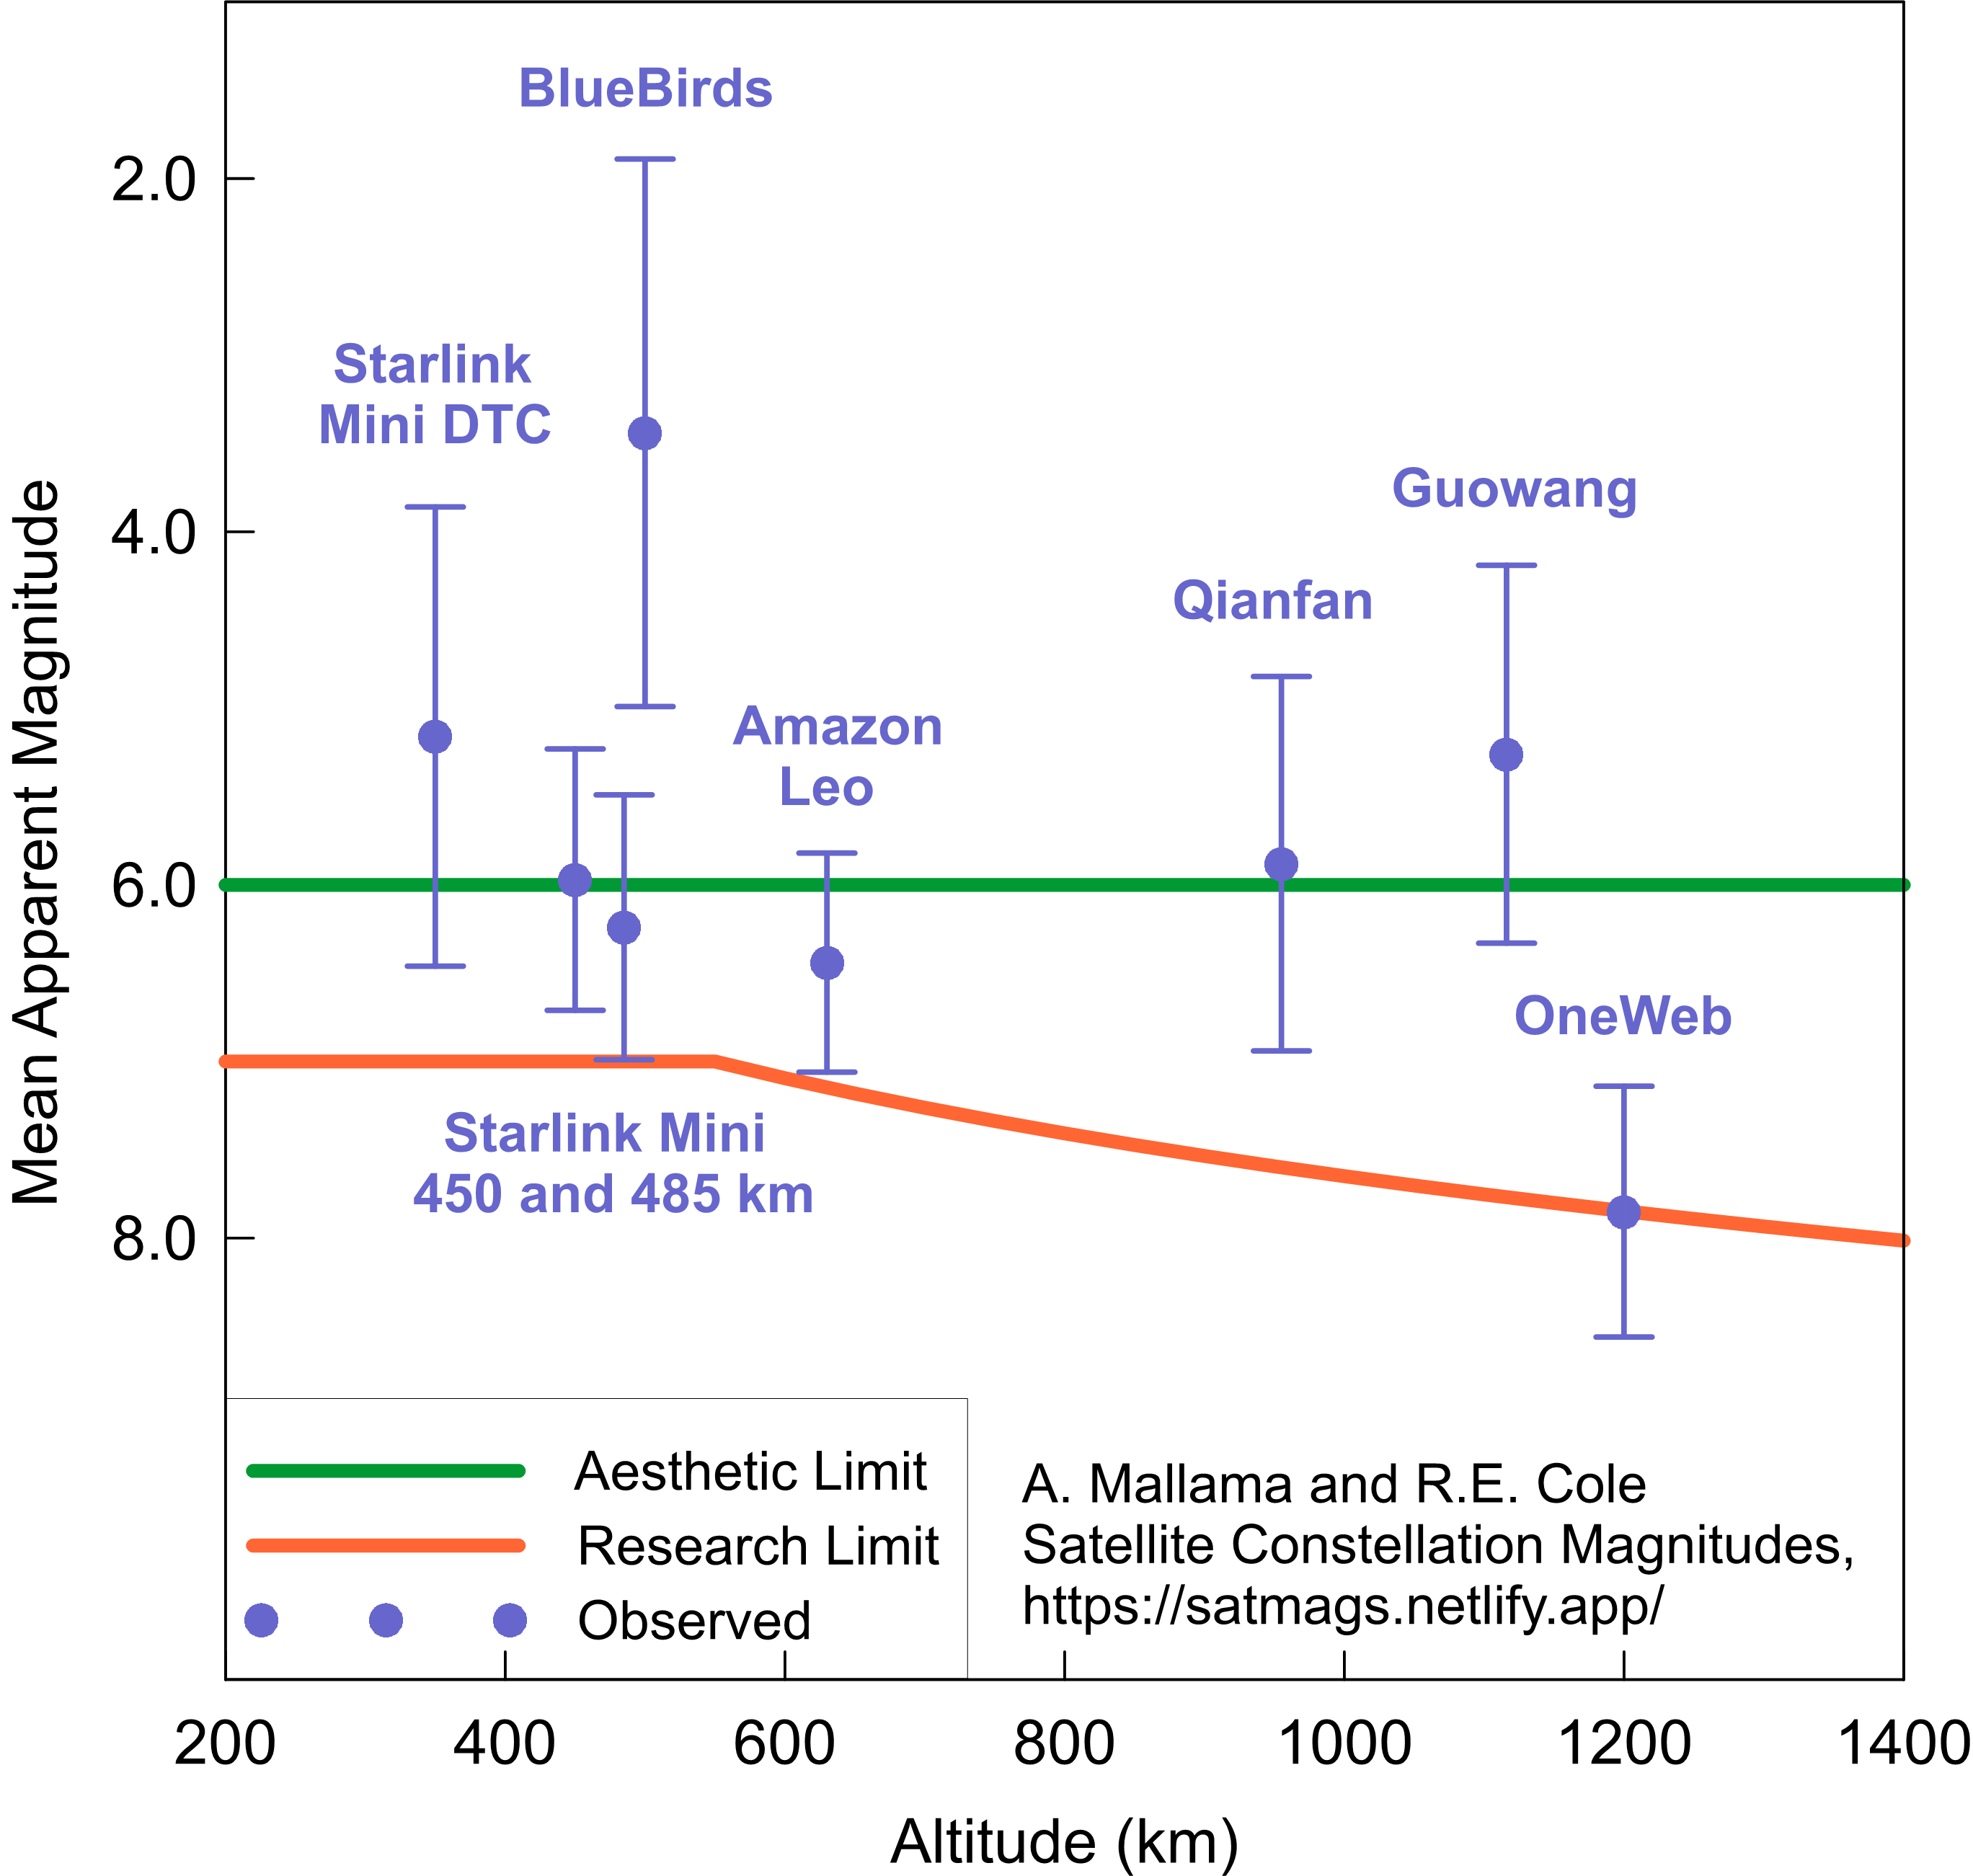
The graph below compares observed apparent magnitudes of constellation satellites to brightness limits established by the International Astronomical Union's Centre for Protection of the Dark and Quiet Sky from Satellite Constellation Interference. Clearly, most constellations exceed the limits for research and aesthetics.
The mean apparent brightness for every satellite constellation except OneWeb exceeds the research limit. Approximately half of OneWeb magnitudes also exceed that limit. For other constellations, one standard deviation fainter than the mean still exceeds the research limit.
With regard to the aesthetic limit, all the mean values are brighter except for OneWeb, Amazon Leo and Starlink Mini satellites at 485 km. One standard deviation brighter than the mean for the Amazon Leos and 485 km Minis also exceeds the aesthetic limit. The bright extreme of the distribution for OneWeb does not exceed that limit, so they are generally not visible to the unaided eye.
Besides the satellites discussed above, SpaceX launched three models of Starlink spacecraft that are now discontinued. Furthermore, their Mini satellites no longer orbit-raise to 550 km. These four cases are listed in the bottom section of the table below. All the mean apparent brightness values exceed the research limit, while those of V1.0 and V1.5 also exceed the aesthetic limit.
The plotted value are listed in the 'apparent' magnitude columns of the table. All these statistics are taken from comprehensive studies of individual constellations. The magnitude values combine electronic Mv magnitudes with others obtained by eye. The spectral sensitivities of these bands are nearly the same so they are treated jointly. The table also includes results derived from unpublished data for the Guowang constellation, Starlink V1.5 satellites, and Starlink satellites at 450 and 485 km.
| Constellation | Height (km) | Apparent Mean | Apparent SD | Apparent SDM | 1000km Mean | 1000km SD | 1000km SDM | Mags | Ref. |
|---|---|---|---|---|---|---|---|---|---|
| SL-Mini-DTC | 350 | 5.16 | 1.30 | 0.06 | 6.47 | 1.32 | 0.06 | 549 | [1] |
| SL-Mini-450 | 450 | 5.97 | 0.74 | 0.03 | 7.15 | 0.63 | 0.03 | 534 | ** |
| SL-Mini-485 | 485 | 6.24 | 0.75 | 0.03 | 7.15 | 0.70 | 0.03 | 570 | ** |
| BlueBirds | 500 | 3.30 | 1.70 | 0.07 | 3.77 | 1.45 | 0.06 | 546 | [2] |
| Amazon Leo | 630 | 6.44 | 0.62 | 0.02 | 6.81 | 0.64 | 0.02 | 758 | ** |
| Qianfan | 955 | 5.76 | 0.94 | 0.04 | 5.24 | 0.72 | 0.04 | 1,161 | [3] |
| Guowang | 1,053 | 5.07 | 1.16 | 0.05 | 4.21 | 0.85 | 0.04 | 455 | ** |
| OneWeb | 1,200 | 7.85 | 0.71 | 0.01 | 7.05 | 0.66 | 0.01 | 80,000 | [4] |
| SL-V1.0* | 550 | 5.05 | 0.52 | 0.00 | 5.89 | 0.46 | 0.00 | 60,000 | [5] |
| SL-VisorSat* | 550 | 6.43 | 0.86 | 0.00 | 7.21 | 0.89 | 0.00 | 40,000 | [5] |
| SL-V1.5* | 550 | 5.67 | 0.73 | 0.04 | 6.34 | 0.86 | 0.05 | 268 | ** |
| SL-Mini-550* | 550 | 6.36 | 0.63 | 0.01 | 7.22 | 0.83 | 0.01 | 3,869 | [6] |
* - Satellite/model/height configuration is discontinued
** - Unpublished
SL - Starlink
SD - Standard deviation
SDM - Standard deviation of the mean
Table updated 2025 June 29
The table also reports statistics for apparent magnitudes that are adjusted to a range of 1,000 km. This allows for comparison between different constellations at a uniform distance.
The BlueBird constellation is the brightest by apparent and 1000-km magnitude. Fortunately, their numbers are far smaller than the other constellations studied here.
The mean 1000-km brightness of Starlink Mini satellites orbiting at 550 km from Generation 2 are fainter than all models of Starlink Gen 1 spacecraft. This illustrates the successful brightness mitigation implemented by SpaceX, because the Minis are more than four times as large. Unfortunately, the mean apparent brightness values of the subsequent lower altitude Gen 2 Mini spacecraft (DTC, 450 km and 485 km) are greater than the Minis at 550 km due to their smaller distances.
References
[1] SL-Mini-DTC: Mallama, A., Cole, R.E., Respler, J. and Harrington, S. 2025. Characterization of Starlink Direct-to-Cell satellites in brightness mitigation mode. arxiv.org/abs/2502.03651.
[2] BlueBirds: Cole, R.E., Mallama, A., Harrington, S. and Respler, J. 2025. Initial observations of the first BlueBird spacecraft and a model of their brightness. arxiv.org/abs/2505.05820. (The statistics also include newer data.)
[3] Qianfan: Mallama, A., Cole, R.E., Hellmich, S., Spinner, R., Warner, J. and Respler, J. 2025. Brightness characteristics of the Qianfan satellites and evidence that some are tumbling. arxiv.org/abs/2505.07194.
[4] OneWeb: Mallama, A. 2022. OneWeb satellite brightness – characterized from 80,000 visible light magnitudes. arxiv.org/abs/2203.05513.
[5] SL-V1.0 and VisorSat: Mallama, A. 2021. Starlink satellite brightness -- characterized from 100,000 visible light magnitudes. arxiv.org/abs/2111.09735.
[6] SL-Mini-550: Mallama, A. 2023. Mallama, A., Cole, R.E., Harrington, S.,
Hornig, A., Respler, J., Worley, A. and Lee, R. Starlink Generation 2 Mini satellites: photometric characterization. arxiv.org/abs/2111.09735. (The statistics also include newer data.)
Credit for star pictures: NASA and ESA.
Citation: A. Mallama and R.E. Cole, Satellite Constellation Magnitudes, https://satmags.netlify.app/